Fundus autofluorescence in age-related macular degeneration
Fundus autofluorescence in age-related macular degeneration
Authors:
José Mª Ruiz-Moreno, MD, PhD.
President of the Spanish Society of Retina and Vitreous (SERV).
Professor of Ophthalmology, Castilla La Mancha University (UCLM).
Head of the Ophthalmology Department, Puerta de Hierro University Hospital. Madrid.
Medical Director Vissum Corporation. Spain.
Javier A Montero, MD, PhD
Head of the Ophthalmology Department, Rio Hortega Hospital, University of Valladolid. Valladolid.
Retina Unit, Oftalvist. Madrid.
Associate Professor of Ophthalmology, European University, Madrid. Spain.
Jorge Ruiz-Medrano, MD.
Fellow of surgical and medical retina. Jules Gonin Eye Hospital. Fondation Asile des Aveugles. Lausanne. Switzerland.
Acknowledgements:
The authors have neither economical nor commercial interest in the devices and procedures described.
The authors wish to thank TOPCON Spain SA for its help providing the Spaide AF filter Set and adapting it to the Topcon TRC-50DX camera.
All the images presented in this chapter were obtained using this system and Spectralis OCT.
Updated/reviewed by the authors, July 2017.
Definitions
Fluorescence is the capability of absorbing light at a specific wavelength and releasing it at a longer, less energetic wavelength. This phenomenon raises an especial interest when the released radiation is found within the spectrum of visible light permitting its visualization, recording and measurement.
Autofluorescence is the spontaneous fluorescence that some substances present naturally.
Fluorophore is the part of a molecule that makes it fluoresce.
The human eye contains autofluorescent substances in the retina, especially within the retinal pigment epithelium (RPE). The main autofluorescent component of the RPE is lipofuscin (LF), containing at least ten different fluorophores presenting discrete emission spectra within the green, golden-yellow, yellow-green, and orange-red emitting range(1).
When LF granules are stimulated with light within the blue range, a characteristic yellow fluorescence is emitted(2).
Basic considerations on fundus autofluorescence
The RPE plays an important role in the physiopathology of age-related macular degeneration (AMD)(3, 4). The study of RPE can help to achieve a better understanding of AMD and to find new ways of early diagnosis as well as new prognostic and progression markers for this condition. LF originates from the constant phagocytosis of the shed outer segment disks of the photoreceptors and is accumulated in the cytoplasm of RPE cells(5,6). This accumulation is considered to be a hallmark of RPE aging (7). Some experimental studies have addressed the molecular mechanisms of the interaction of excessive LF with the normal cellular functions of RPE(8,9). According to these studies, A2-E (N-retinylidene-N-retinylethanol-amine) has been identified as the main fluorophore of LF. A2-E may play a toxic effect including phototoxic and detergent actions, as well as an inhibitory effect on lysosomal function(10,11). It has been suggested that the photo-oxidation by-products related to LF may trigger the complement cascade, thus contributing to the pathological chronic inflammation of the macular area(12). New studies have been designed to improve our understanding of potential underlying molecular mechanisms. The autofluorescence of LF, its distribution in post-mitotic human RPE cells and its accumulation with age have been extensively studied in post-mortem eyes with fluorescence microscopy(14,15). In the past few years new research on ocular autofluorescence in vivo has also been performed.
Ultraviolet light is frequently used to visualize LF by fluorescence microscopy ex vivo, since light absorption limits the transmission of ultraviolet light within the retina in human living eyes. However, due to the wide range of excitation of LF (from 300 nm to 600 nm), visible light can be used to visualize its fluorescence in vivo. The emitted spectrum ranges from 480 to 800 nm and peaks within the range of 600 to 640 nm(15).
Fundus autofluorescence (FAF) imaging of the human living eye is a relatively new imaging method that provides a topographic map of the distribution of LF in the RPE. The detection of FAF is limited by its low intensity (approximately two orders of magnitude lower than the peak background fluorescence of an ordinary fluorescein angiography), and by the FAF characteristics of the anatomic structures of the eye, including those of the optical media, especially of the lens(16).
Imaging methods
1. Fundus spectrophotometry
Fundus spectrophotometry was developed by Delori et al. and was designed to determine the spectrum of excitation and fluorescence emission from small areas of the retina (2º diameter)(17,18). The authors were able to determine the amount of FAF and compare it with in vitro fluorescence microscopy. They found out that the spectrum of in vivo excitation was slightly broader, and peaked at a longer wavelength than those of A2E and native LF, concluding that considering the spatial distribution, spectral characteristics and age relationship, LF is the main source of fluorescence in the FAF in vivo(18).
Currently there are two available systems to examine the FAF of the human eye in vivo in the clinical practice: confocal scanning laser ophthalmoscope and fundus camera.
Scanning laser ophthalmoscope
Confocal scanning laser ophthalmoscope (cSLO) was originally developed by Webb et al. using a low-energy laser source to scan the retina in two directions termed as x and y(19). The confocal nature of the optics ensures that the reflectance and fluorescence correspond to the same focal plane. cSLO overcomes the limitations of the low-intensity signal of FAF and the lens interferences. The defocused light is almost completely suppressed, thus reducing the FAF from the optical media anterior to the retina, such as the lens or the cornea. In order to reduce the background noise and to increase the contrast of the image, a series of FAF images are usually recorded(20,21). Following the aligning of the images in order to correct the movement of the eye during the acquisition, the final image is calculated (usually from 4-32 frames) and the values of the pixels are normalised.
The FAF image can be obtained with low excitation energies within the limits of maximum retinal irradiance established by the American National Standard Institute and other international standards(22). cSLO enables the acquisition of FAF images from wide areas of the retina (55º with one frame and even larger areas using the composite mode)(20,22). Although limited by the optical properties of the human eye, SLO succeeds in imaging the posterior pole with a high contrast(23).
Currently, there are three different cSLO systems for FAF imaging: the Heidelberg Retinal Angiograph (HRA) (based on the HRA classic, HRA 2 and the Spectralis HRA) (Heidelberg Engineering, Dossenheim, Germany); the Rodenstock cSLO (RcSLO; Rodenstock, Weco, Düsseldorf, Germany); and the Zeiss prototype SM 30 4024 (ZcSLO; Zeiss, Oberkochen, Germany). HRA is the only currently commercially available system with the cSLO system to capture FAF images. HRA uses an excitation wavelength of 488 nm from an Argon laser or a solid-state laser. A barrier filter with a short-wavelenght cut-off at 500 nm is inserted just opposite the detector, blocking the laser light and letting the autofluorescent light through.
There are currently 3 kinds of cSLO-based FAF techniques:
- Short wavelength FAF (486 nm blue laser): The most extended cSLO since 2009, which basically excites the RPE LF;
- Long wavelength FAF (787 nm infrared laser): Less used, it excites the melanin of the RPE mainly;
- 518 nm green laser FAF has also been employed lately. This wavelength is absorbed by the macular pigment to a lesser extent, showing a clearer image of the foveal RPE.
The device uses both lasers and it is able to simultaneously capture both images and use them to measure the distribution of the macular pigment. Blue FAF images acquired with a cSLO operating at an excitation wavelength of 486 nm present a dark area in the fovea caused by absorption of blue light by the macular pigment. However, green FAF images acquired at a wavelength of 518 nm show much less of a shadowing effect as green light is less absorbed by macula pigment (Figure 1). Both blue and green FAF images can be used to quantify the macular pigment distribution(24).
In patients with geographic atrophy (GA) that present with foveal sparing, the border of the atrophic area is easily recognizable on green FAF images. The quantification of areas of GA becomes more reliable when using green FAF images. The patterns of hyperfluorescence seem similar in blue and green FAF images. Meanwhile, it has been made possible to acquire real time images, a technique known as real-time averaging.
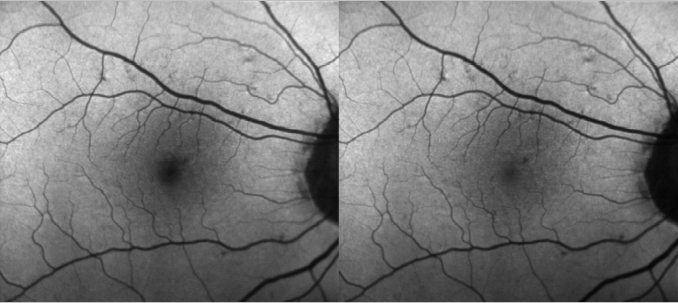
Figure 1. Differences between blue and green FAF.
The Rodenstock cSLO and the Zeiss prototype SM 30 4024 have also been used to acquire clinical FAF images. Both systems use an excitation wavelength of 488 nm (the same as the HRA), and barrier filters at 515 nm and 521 nm, respectively(20,21,25). Bellmann et al. have noticed marked contrast and brightness differences as well as in the grey range (an important marker of the image quality between the different systems of cSLO). These limitations must be taken into consideration when comparing images from different cSLO systems(25).
The default software of the HRA system normalizes the pixel distribution of the final image in order to improve the distribution of the FAF intensity. Even though this final step facilitates the evaluation of the localized topographic differences, it allows a relative estimation of the intensities of the FAF. Thus, it should not be used for quantitative calculation and absolute comparison between different FAF images. The normalization of the average images can be easily turned off, and brightness and contrast can be manually adjusted to permit an adequate visualization of the distribution of FAF in areas with a very high or very low signal in order to improve the visualization of small details.
Fundus camera
Fundus cameras are widely used in clinical routine for imaging the retina as fundus photographs, reflectance photographs and fluorescein angiography. Fundus cameras use a single flash to capture images from large retinal areas. When confocal optics are not available, the FAF signal from all the ocular structures with fluorescent properties reaches the camera, and scattered light, anterior and posterior to the plane of interest can influence the detected signal(26-28). The lens contributes significantly to the FAF signal when similar wavelengths are used in the blue-range, as for the cSLO (wavelength = 488 nm), particularly in older patients with lens yellowing and nuclear opacities. Flashlight intensities and detector gain have to be set at relatively high levels in order to obtain reasonable FAF images. However, the signal-to-noise ratio decreases simultaneously which may result in reduced image quality. To reduce interference from lens fluorophores that mainly emit in the range between 510 to 670 nm, Spaide modified the excitation filter (peak 580 nm, bandwidth 500-610 nm) and the barrier filter (peak 695 nm, bandwidth 675-715 nm).
A further modification was introduced in 2007 using a slightly different filter set (excitation bandwidth 535-580 nm, emission bandwidth 615-715 nm)(29), thus improving signal-to-noise ratio and image quality. Furthermore, as this setup of the fundus camera uses different excitation and emission filters compared with the cSLO, it may even visualize other retinal fluorophores. However, a systematic comparison of different pathologies with clinico-pathological correlations between cSLO and fundus camera, particularly in patients with AMD, has not yet been performed.
In this chapter we will present a series of images of patients suffering from different forms of AMD using both fundus camera and Spectralis cSLO.
Originally, a fundus camera that enabled imaging with a field of 13º was used. Afterwards, Spaide has obtained images of the spatial distribution of FAF intensities over larger retinal areas up to 50º with his new modified fundus camera(26-29). In the near future it will be possible to improve FAF imaging with the aid of new filters and some other innovations, and increased experience. Furthermore, it is already possible to visualise different fluorophores from the retina with the configuration of the fundus camera using excitation and emission filters for the cSLO.
Autofluorescence imaging in the human eye in vivo
FAF images show the spatial distribution of the intensity of FAF of each pixel in grey values (arbitrary values from 0 to 225); low intensities are commonly known as low pixel values (dark) and high intensities as high pixel values (light).
Normal fundus
FAF imaging shows a consistent pattern of FAF distribution in normal eyes(21). Such common findings have been reported in children as young as four years old(30). The macular FAF signal is reduced at the fovea because it is limited by the presence of lutein and zeaxanthin in the neurosensory retina. The signal is higher in the parafoveal area and tends to increase as we move away from it, peaking at the most peripheral retinal areas. It has been suggested that this FAF pattern is caused by the melanin deposition and density of LF granules at the different areas of the retina(18,31). The optic nerve head typically appears dark mainly due to the absence of RPE. The retinal vessels are associated with a markedly reduced FAF signal because of the blocked fluorescence (Figure 2).
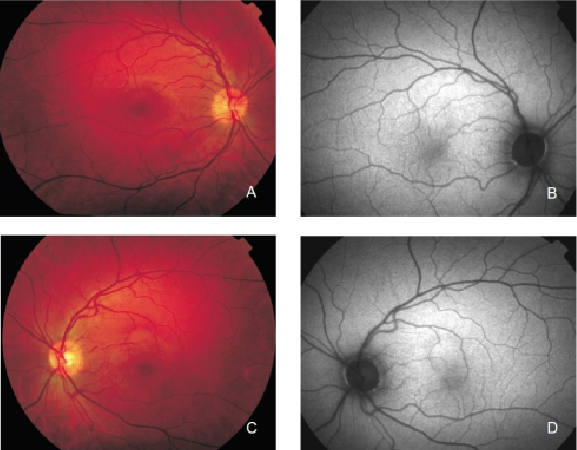
Figure 2. Colour fundus and FAF from a normal subject. (A) Right eye colour fundus and (B) FAF photographs. (C) Left eye colour fundus and (D) FAF photographs.
The common ratios of gGeographic atrophy (GA)rey intensity between the fovea and the perifoveal area have been established(32,33). Considering these findings, any deviation from the normal pattern in a specific location can be easily identified; hence the qualitative description of the local changes in the FAF is widely used. The changes in signal intensity are qualitatively described as decreased, normal, or increased as compared to the background signal of the same eye.
FAF imaging in AMD
When examined with FAF, the fundus of patients with AMD may show a range of signal changes(20,34-38). Assuming that RPE has an important role in the pathophysiology of AMD and that the major fluorophores in the retina are located within RPE cells, FAF imaging can show changes in the concentration and distribution of RPE LF and hence establish the condition of RPE in patients with AMD. Therefore, atrophic RPE typically appears as dark patches in FAF and can be clearly delineated, even better than in normal fundus photograph (Figure 3)(21,39).
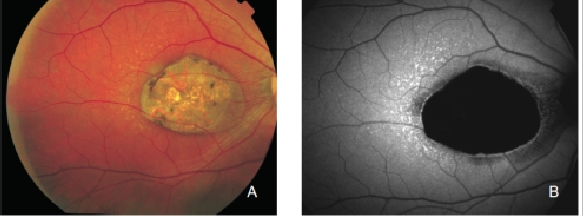
Figure 3. Atrophic area of RPE. These areas typically appear as dark patches in FAF images and can be clearly delineated. (A) Colour fundus and (B) FAF photographs.
All this information can be obtained from a quick and minimally invasive exploration with FAF. The decreased FAF intensity may also be associated with hyperpigmented areas due to the melanin absorption of light(36,40). However, it should be considered that other fluorophores than LF can be found in RPE and become more prominent in AMD patients, and hyperpigmented areas may also cause an increase in the signal, which is supposed to result from the accumulation of melanolipofuscin.Other changes in FAF which are not related to RPE defects may appear in AMD. Fresh haemorrhages typically appear dark due to blocked fluorescence (Figure 4). However, these haemorrhagic areas eventually synthesize substances and fluorophores, which are observed in the fundus as yellowish areas and in FAF images as increased signals (Figure 5)(41).
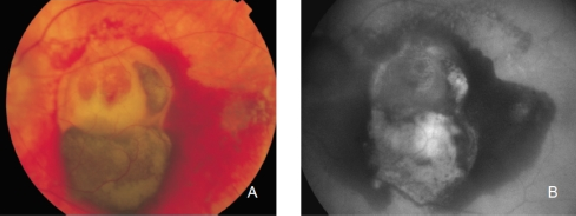
Figure 4. Fresh haemorrhage in the left eye from a patient with choroidal neovascularization (CNV) secondary to AMD. Fresh haemorrhages typically appear dark due to blocked fluorescence. (A) Colour fundus and (B) FAF photographs.
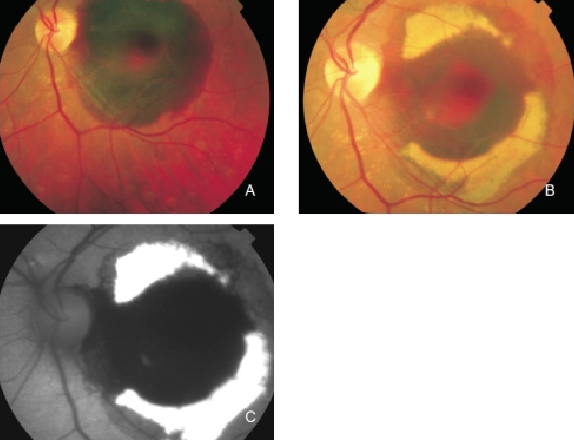
Figure 5. Haemorrhage in the left eye of a patient with CNV secondary to AMD. Fluorophores eventually appear in haemorrhagic areas which are observed as yellowish areas in the fundus and as an increased FAF signal. (A) Colour fundus photograph of the fresh haemorrhage. (B) Colour fundus photograph from the same eye one month later. (C) FAF of the haemorrhage.
Pigment epithelial and neurosensory detachment and areas with extracellular fluid accumulation associated with exudative lesions can be observed in FAF as increased or decreased signal intensity. Fluid accumulation under pigment epithelium detachment (PED), extracellular deposition of material under the RPE (drusen), and fluid originated from CNV can occur with increased, normal or decreased FAF intensity. This phenomenon is a consequence of the presence of unknown autofluorescent molecules other than LF, in the same spectral range than LF. FAF imaging alone may not distinguish between melanolipofuscin from RPE cells migrated into the neurosensory retina and LF within the normal RPE layer. It is always necessary to compare the FAF findings with those from other techniques such as fundus photograph, reflectance image, fluorescein angiography or optical coherence tomography (OCT)(36, 40).
FAF in early AMD
Early AMD is characterised by the appearance of localized RPE hypo or hyperpigmentation and drusen. Drusen are formed by the accumulation of extracellular deposits in the inner aspects of Bruch’s membrane(3). Depending on their size and morphology, they can be classified as hard or soft drusen. The molecular composition of drusen is quite complex and has not been completely elucidated (Figure 6).
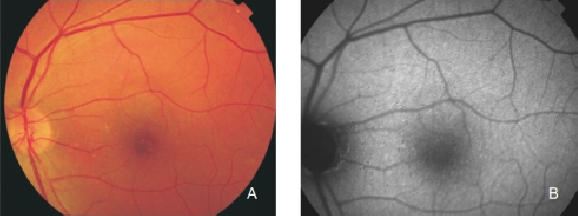
Figure 6. Small drusen from a patient with early AMD in the left eye. (A) Colour fundus and (B) FAF photographs.
FAF changes in early AMD have already been reported by several authors(9,21,26,28,34-37,42); all of them concluding that the changes in ophthalmoscopy and fluorescein angiography are not necessarily related to FAF, suggesting that FAF may provide new information regarding the stages and activity of the disease.
Differentiation between RPE LF and sub-RPE deposits with FAF images in vivo can be a hard work. An analysis of the variability of FAF in patients with early AMD was reported in an international workshop on FAF phenotype in early AMD. Among their conclusions, a new classification system with eight different FAF patterns was given(40).
Normal pattern characterized by a homogeneous background autofluorescence with a gradual fluorescence decrease in the inner macula towards the foveola (blocked fluorescence caused by yellow macular pigments). AF may be normal even in the presence of soft or hard drusen.
Minimal change pattern characterized by a limited and irregular decrease or increase of background FAF, not associated to any obvious or important topographic pattern.
Focal increased pattern is defined by the presence of at least one well defined spot (<200 micron diameter) of markedly increased FAF much brighter than the surrounding background fluorescence. These areas may or may not correspond to large, soft drusen and to areas of hyperpigmentation.
Patchy pattern, characterized by the presence of at least one large area with well-defined borders (>200 micron diameter) of markedly increased FAF. Again, these areas may or may not correspond to large, soft drusen and areas of hyperpigmentation.
Linear pattern defined by the presence of at least one linear area of markedly increased FAF with well-defined borders. Linear structures of increased FAF usually correspond to hyperpigmented lines. This pattern shows multiple branching lines of increased FAF forming a lacelike pattern. The borders may be hard to define, and FAF may gradually decrease from the centre of the linear area towards the surrounding background. This pattern may correspond to hyperpigmentation or to non-visible abnormalities.
Reticular pattern is defined by the presence of multiple small, well-defined areas (<200 micron diameter) of decreased FAF. This pattern has been found to occur not only in the macular area, and may be associated with multiple small soft drusen, hard drusen or areas with pigment changes or non-visible abnormalities.
Speckled pattern is characterized by the simultaneous presence of different types of abnormalities in a large area. The changes reach beyond the macular area and may cover the entire posterior fundus. These abnormalities include multiple small areas of irregular increased or decreased FAF corresponding to hyper and hypopigmented areas and multiple subconfluent and confluent drusen.
The speckled pattern has been reported to be the most frequent (26%) followed by the patchy pattern (23%). The most infrequent patterns are the normal pattern (2%) and the lacelike pattern (2%). The study confirmed that visible drusen on fundus photography are not always correlated with noticeable FAF changes and that areas of increased FAF may or may not correspond to areas of hyperpigmentation or soft or hard drusen. Several authors have also mentioned the different FAF patterns in eyes with drusen.
Delori et al. described a pattern consisting of decreased FAF in the centre of the drusen surrounded in most of the cases by a ring of increased FAF(27). They also observed that the decreased drusen signal was not as intense as in the areas with RPE atrophy. The authors hypothesized that it might be caused by a displacement of the cytoplasm and LF granules in RPE cells instead of an actual RPE atrophy(36).
Von Rückmann et al. further reported that crystalline drusen are characterised by a decrease in FAF, signalling the onset of atrophy(21). Lois et al. confirmed that areas of confluent drusen are usually associated with focal, mildly increased FAF and that only large subfoveal soft drusen (drusenoid RPE detachments) topographically correspond with focal changes of FAF (Figure 7)(33).
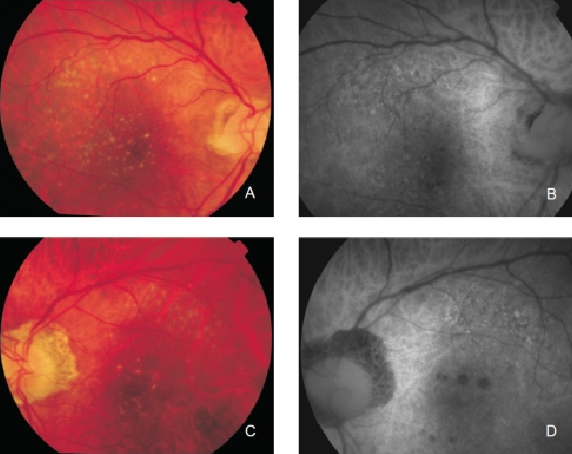
Figure 7. Drusen in a patient with early bilateral AMD. (A) Right eye colour fundus and (B) FAF photographs. (C) Left eye colour fundus and (D) FAF photographs.
Smith et al. reported their results after using image analysis software to study drusen and pigmented areas on fundus photographs from AMD patients(42). The authors initially used image analysis algorithms, including automated background levelling and thresholding. Areas of focally increased FAF intensities were compared to the normal background signal. By overlapping fundus photographs and FAF, the topographic correlation of drusen and pigmented areas with focally increased FAF signals was established.
Smith and co-workers reported that eyes with isolated drusen or pigment abnormalities were better correlated with FAF abnormalities than eyes with GA(42).
Regarding areas with changes in RPE, hypopigmented areas are usually associated with a corresponding decreased FAF signal, suggesting an absence or degeneration of RPE cells, with reduced content of LF granules (Figures 8 and 9).
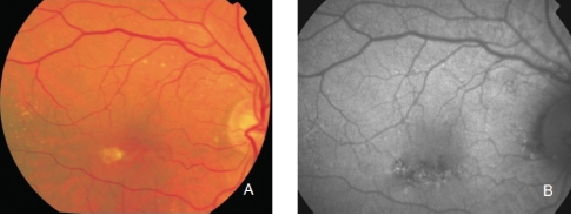
Figure 8. RPE hypopigmentation in the macular area secondary to AMD. Hypopigmented areas are usually associated with correspondingly decreased FAF signals, suggestive of RPE cells loss or degeneration with reduced content of LF granules. (A) Colour fundus and (B) FAF photographs.
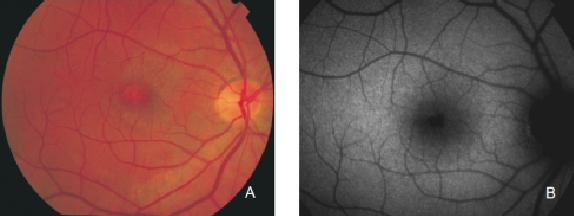
Figure 9. RPE hypopigmentation in the macular area secondary to AMD. (A) Colour fundus and (B) FAF photographs.
However, hyperpigmented areas frequently show a higher FAF signal, which may be caused by a higher concentration of autofluorescent melanolipofuscin (Figure 10)(36).
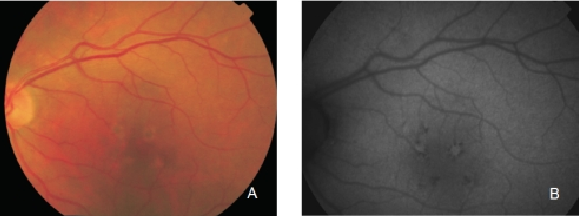
Figure 10. RPE hyperpigmentation in the macular area secondary to AMD. Areas with hyperpigmentation frequently show a higher FAF signal which may be caused by a higher amount of autofluorescent melanolipofuscin. (A) Colour fundus and (B) FAF photographs.
Reticular pseudodrusen are seen as small triangular deposits above the RPE in OCT imaging. Infrared pictures show them as small white spots with a surrounding darker halo and FAF typically show an orange skin pattern (Figure 11).
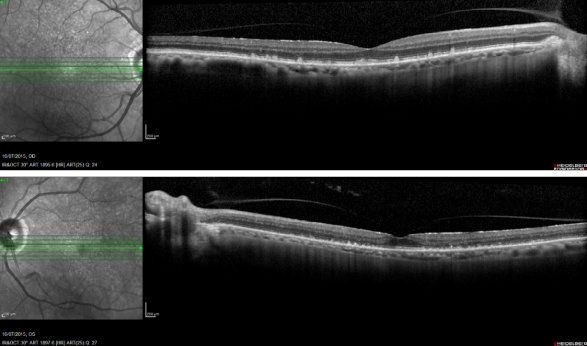
Figure 11. Reticular pseudodrusen. FAF and SD-OCT of a patient with bilateral reticular pseudodrusen.
FAF in advanced AMD
Advanced AMD is characterized by geographic atrophy (GA), choroidal neovascularization (CNV), pigment epithelial detachment (PED), RPE tears and disciform scars.
Geographic atrophy (GA)
GA is thought to be the natural end stage of the atrophic AMD process when CNV does not appear. GA occurs in areas where the RPE is dead and the outer neurosensory retina and choriocapillaris disappeared(43,44). Due to the loss of RPE and LF, the atrophic area appears dark in FAF imaging(36). High contrast between the atrophic and the non-atrophic retina defines the area of GA more precisely than colour fundus photographs, permitting a clearer and more specific study of GA, as well as its natural development and evolution (Figures 12 and 13)(39,45).
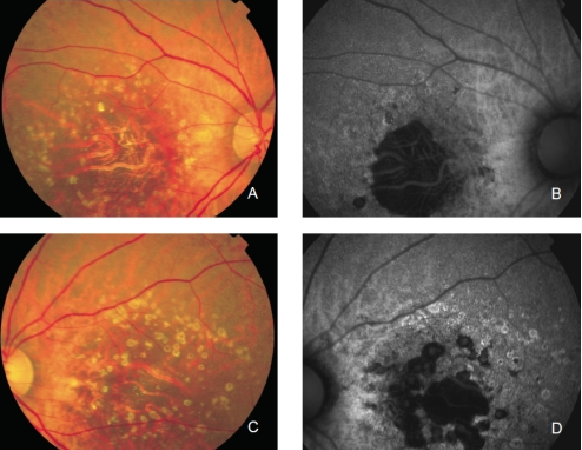
Figure 12. GA secondary to AMD. The loss of RPE and LF causes a characteristic absence of FAF signal (a dark area in FAF images). (A) Right eye colour fundus and (B) FAF photographs. (C) Left eye colour fundus and (D) FAF photographs.
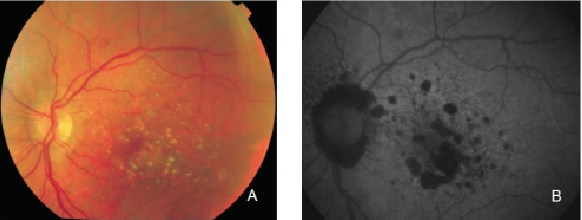
Figure 13. GA secondary to AMD. The high contrast between atrophic and non-atrophic retina enables the delineation of the atrophic area more precisely than can be performed from conventional fundus photographs. (A) Colour fundus and (B) FAF photographs.
The GA patches usually become larger and coalesce as AMD progresses(46,47). An excessive accumulation of LF, and therefore an increased FAF in the junction are highly suggestive of the appearance or progression of pre-existing GA (Figure 14).
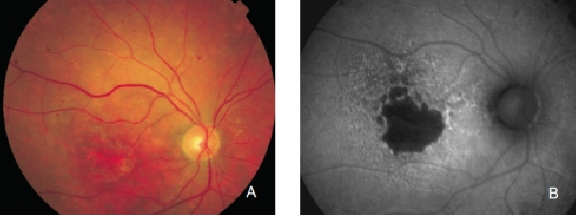
Figure 14. GA secondary to AMD with increased autofluorescence in the junction. New areas of GA and the extension of pre-existing areas are characterised by an excessive accumulation of LF, and therefore an increased FAF signal. (A) Colour fundus and (B) FAF photographs.
Preliminary observations suggest that different phenotypes may appear associated with junction FAF changes(48).
A new classification for junction FAF patterns has been proposed in GA patients(Figure 15)(49).
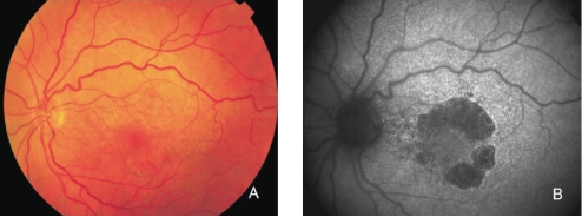
Figure 15. GA secondary to AMD with a banded pattern of increased autofluorescence in the junction. (A) Colour fundus and (B) FAF photographs.
Proposed classification for junction FAF patterns in GA(49):
- Focal increased FAF is defined by single or multiple spots of focal markedly increased FAF localized at the border of the atrophic patch;
- Band pattern of increased FAF is characterized by a continuous stippled band of increased FAF surrounding the entire atrophic area;
- Patchy increased FAF are large patches of increased FAF outside the GA area. FAF tends to be less intense than that in the focal pattern described above;
- Diffuse increased FAF is the most frequent pattern of increased FAF in eyes with GA.
FAF changes are not limited to the border of the atrophic area and may show inter individual differences that have been further classified into four subtypes:
- Reticular pattern, characterised by several lines of increased FAF usually following a radial pattern;
- Branching pattern shows a diffusely increased FAF with a fine branching pattern of increased FAF;
- Fine granular pattern is defined by a large area of increased FAF with a granular appearance surrounding the GA area and a clear border between the granular increased FAF and the surrounding normal background FAF;
- Fine granular with peripheral punctate spots pattern is characterised by diffuse FAF changes surrounding the atrophic area with elongated small lesions and increased FAF.
Refined phenotypes help to identify the prognosis and seem to be a prerequisite to determine specific genetic factors in a complex, multifactorial disease such as AMD. An analysis of the follow-up of junction FAF patterns in GA and the rate of progression of atrophic lesions revealed that variation in GA growth rates are dependent on the specific phenotype of FAF at baseline(50). Atrophy enlargement was slowest in eyes with normal FAF pattern (median, 0.38 mm2/year), followed by focal FAF pattern (median, 0.81 mm2/year), diffuse FAF pattern (median, 1.77 mm2/year) and banded FAF pattern (median, 1.81 mm2/year). The rate of progression of GA in eyes with patchy FAF pattern were not included in this analysis because of their low frequency, insufficient for statistical analysis. The rate of progression of band and diffuse FAF patterns were significantly higher compared to eyes without FAF abnormalities and focal FAF pattern.
Another interesting finding of this study was the identification of eyes with extremely rapid progression of the atrophy, showing distinct FAF features of atrophy that had not been previously reported.
The authors introduced the term diffuse trickling for a pattern associated with a significantly faster enlargement of atrophy.
Areas with increased FAF and consequently higher concentrations of RPE LF precede the development of new areas of GA or the enlargement of the pre-existing atrophic areas(50).
The phenotypic features of FAF abnormalities may play a stronger influence on the progression of atrophy than any other previously reported risk factors such as smoking, arterial hypertension or diabetes.
The different rates of enlargement of atrophy may be related to heterogeneity at a cellular and molecular level in the disease. The high degree of symmetry in GA suggests that genetic determinants may be involved, rather than nonspecific aging changes.
GA is a relatively slow progressing disease. Currently, FAF patterns are mostly accepted as prognostic predictors for GA progression.
Risk factors for the progression of GA include the perimeter of damaged RPE surrounding the GA lesion, the number and size of foci and the FAF pattern.
It has been shown that hyperautofluorescence of the junction zone surrounding regions of GA is related to a higher progression rate. Holz et al.(50) showed that progression rates in eyes with the banded and the diffuse FAF pattern (especially those with diffuse trickling pattern) were significantly higher compared to eyes with focal patterns or with no FAF abnormalities, and these changes were later confirmed by other authors(51).
Other authors evaluated initial GA lesions and grouped them into three categories: predominantly hyperautofluorescent (hyperAF), both hyper- and hypoautofluorescent (mixed AF), or predominantly hypoautofluorescent (hypoAF). In their series, the FAF characteristics were significantly dependent on the type of atrophic area: initial GA lesions were most commonly mixed AF, while drusen-associated atrophy was most commonly hypoAF(52). Progression of GA areas seems to be symmetrical between both eyes of the same patient and in some series it has been observed that lesion growth is faster in larger lesions, suggesting that progression rate is related to basal area(53). However these findings are controversial. Some groups support a linear model of growth over a quadratic model(54). A square root transformation of baseline GA area appears to ameliorate the effect of baseline area on GA progression. A classification based on the area and the irregularity of the lesion perimeter shows that there is an association with growth rates by providing a measure of the relative border of RPE at risk, since the extent of the junction zone of damaged RPE increases with non-circularity for a GA area(55,56). Measuring the lesion growth in mm2 may not accurately reflect the relative dynamics of progression of the lesion, and a concept such as proportion of growth might be more intuitive. Growth of atrophy is not linear within time, no matter what measurement is used (mm2, border, proportion or square root).
Caire et al. tried to identify the genetic risk factors that contribute to the presence and progression of established GA in a Spanish population. According to their results, genetic risk factors associated with the presence of GA (genetic polymorphisms within CFH, ARMS2 and FHR1-3) are not identical to those related to its progression (polymorphisms of CFB and CFH)(57).
Some samples of patients with GA can be seen in Figures 16, 17 and 18 (FAF defect progression during one year of follow-up).
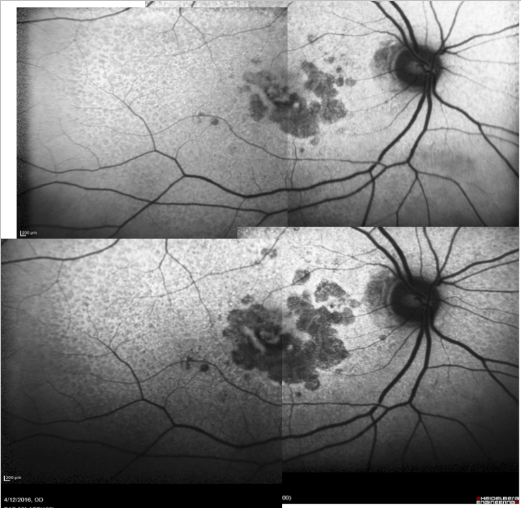
Figure 16. Patient with GA: FAF defect progression during one year of follow-up (example 1).
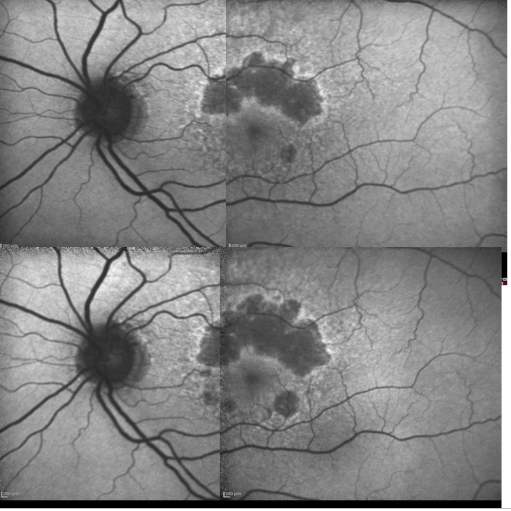
Figure 17. Patient with GA: FAF defect progression during one year of follow-up (example 2).
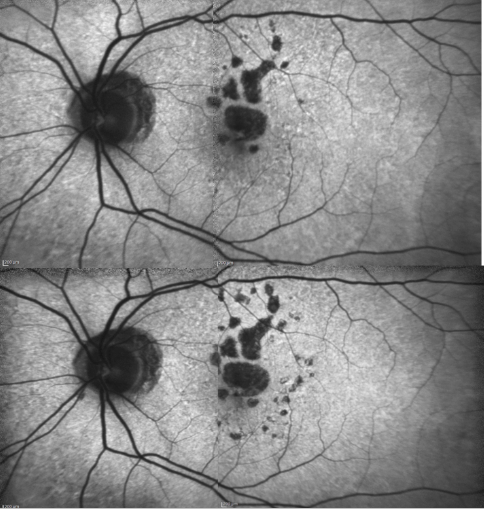
Figure 18. Patient with GA: FAF defect progression during one year of follow-up (example 3).
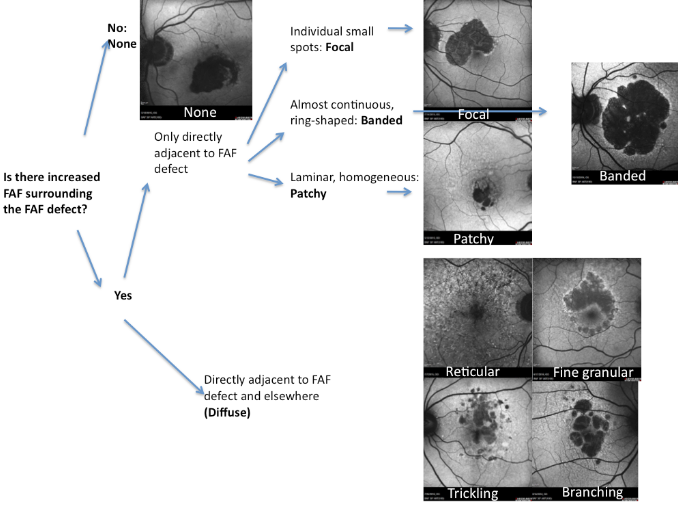
Figure 19. FAF patterns in GA
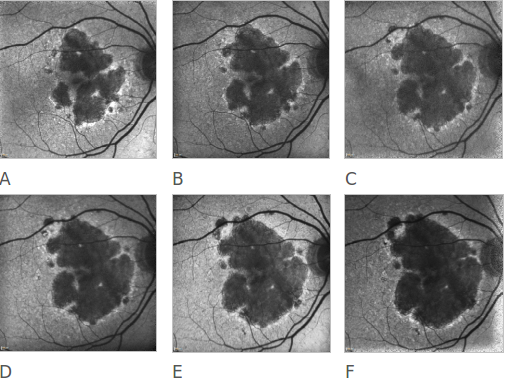
Figure 20. Atrophic AMD progression. FAF of a 78-year-old woman suffering from an atrophic form of AMD. Progression of the disease can be clearly appreciated over a 6 year follow-up (A to F).
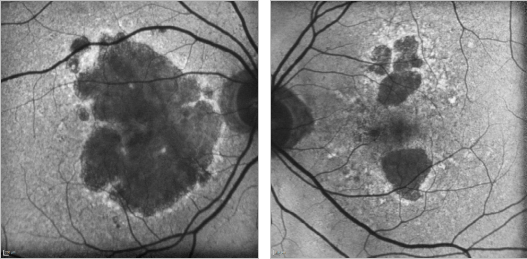
Figure 21. GA case 1: 88-year old woman showing a bilateral atrophic AMD. Although the atrophy is extensive, the foveal centre is still preserved and her visual acuity remains at 0.4 and 0.7 respectively.
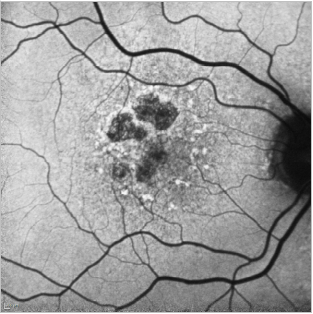
Figure 22. GA case 2: 71-year-old male suffering from dry AMD. FAF shows us the hyperfluorescent drusen and the limits of the GA which allows us to properly follow these patients.
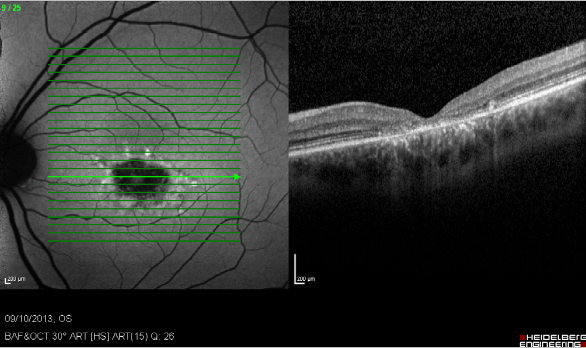
Figure 23. Study of GA with FAF and SD-OCT. Study of dry AMD combining FAF and SD-OCT. The disappearance of layers of the external retina is clearly visible.
Choroidal neovascularization (CNV)
CNV is considered to cause almost 90% of the cases of severe visual loss related to AMD(58). CNV is usually studied by fluorescein angiography and OCT to assess the extent, location and nature of the lesion(58). Fluorescein angiography shows changes in retinal vascularization, but does not reveal how deeply RPE is affected.FAF imaging shows RPE damage, with the advantage that is a non-invasive test, less time consuming than angiography. Several studies have reported that CNV may show irregular FAF alternating areas of increased, normal and decreased fluorescence intensity (Figure 24)(20,35-38). These studies have also reported that areas with previously high levels of FAF may show decreased FAF six months later(37). Data comparing FAF findings in occult and classic CNV are limited. These changes may be secondary to photoreceptor loss, RPE atrophy, replacement of normal phenotypes of RPE cells with scar and increased melanin deposition. These findings may have therapeutic implications and clarify long-term visual prognosis. For example, a person with an active CNV on fluorescein angiography and normal FAF may show a much better outcome than another with an abnormal basal FAF. Spital et al. reported that classic CNV usually shows more focal areas of decreased FAF than occult CNV(35). These findings have been confirmed by McBain et al.(61) who guessed that low FAF at the site of the CNV are related to blocked fluorescence induced by the presence of CNV in the subretinal space, rather than to severe damage to the RPE. Another study did not find significant differences in FAF patterns in early classic and occult CNV secondary to AMD (Figures 25 and 26)(60). A continuous preserved autofluorescence pattern was observed in the central macula in most of the cases. These findings suggest that neovascular complexes, regardless if classic or occult, would be external to the RPE in most cases. Additional studies with a higher number of patients and longer monitoring are required to verify with these changes in patients with CNV (Figure 27).
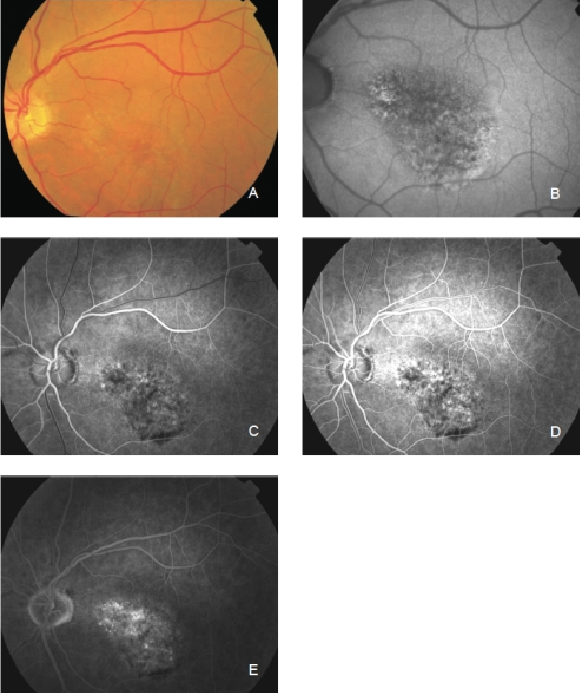
Figure 24. Occult CNV. These lesions show irregular FAF intensities with alternating areas of increased, normal and decreased signal intensity. (A) Colour fundus and (B) FAF photographs. (C) and (D) Early frames fluorescein angiography. (E) Late frames fluorescein angiography.
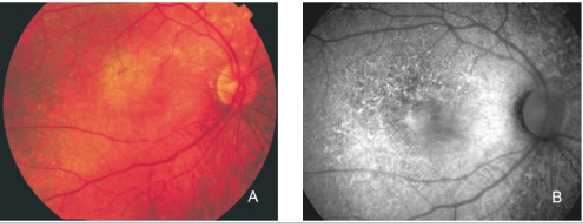
Figure 25. Retinal angiomatous proliferation (RAP). (A) Colour fundus and (B) FAF photographs.
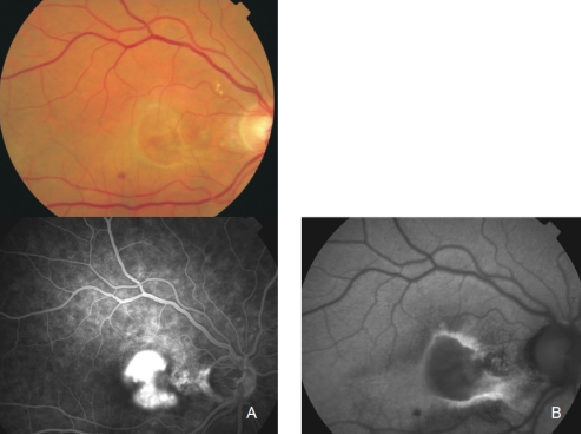
Figure 26. Classic CNV. (A) Colour fundus and (B) FAF photographs.
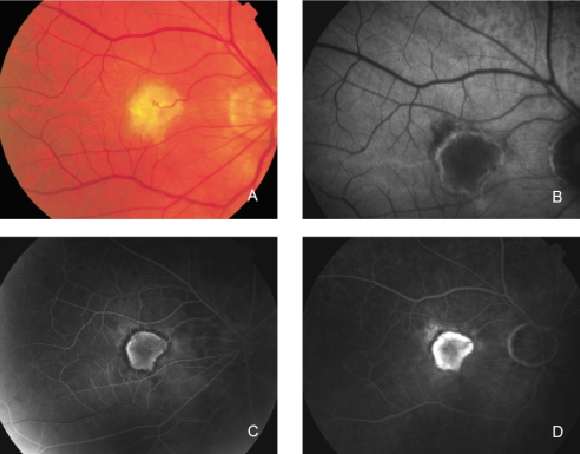
Figure 27. CNV with chorioretinal anastomoses. (A) Colour fundus and (B) FAF photographs. (C) Early frame fluorescein angiography. (D) Late frame fluorescein angiography.
Pigment epithelial detachment (PED)
PED can show different FAF patterns(11,16,32,62). FAF can provide complementary information to that of fundus colour photograph and fluorescein angiography. In most of the cases, a moderately and diffusely increased FAF can be found, surrounded by a clearly defined ring with decreased fluorescence(35,36,62). Occasionally, intermediate or even decreased FAF can be found that may not correspond to the atrophic RPE or to fibrovascular scars. These changes in the FAF could correspond to different stages in the PED evolution(16). These findings in FAF should be compared with those in fluorescein angiography. We should bear in mind that areas with increased FAF do not always correspond to increased or decreased LF. Besides, the presence of other fluorophores, extracellular fluid or degraded photoreceptor remnants should be considered (Figure 28)(16).
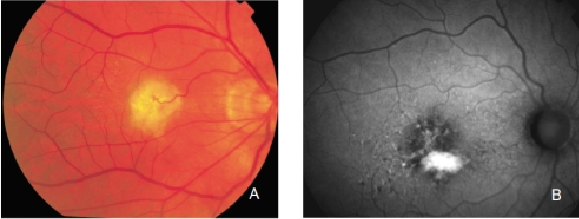
Figure 28. Retinal PED. (A) Colour fundus and (B) FAF photographs.
RPE tears
FAF imaging is a useful tool to diagnose RPE tears(35,63). RPE tears usually occur in association with PED in patients with neovascular AMD, either spontaneously or following therapy(58). FAF imaging reveals absence of autofluorescence in the area denuded from RPE. These areas are clearly identifiable by their very low signal, whereas a heterogeneous FAF signal is seen in the area where the RPE is rolled. Therefore, the exact location of the tear can be delineated in most cases.
Disciform scars
The appearance of disciform scars in FAF imaging depends on their duration and evolution(35,37). Disciform scars may show different variations and alterations of FAF signal. A decreased signal is typically observed in scarred and fibrotic areas. It has been reported that approximately 50% of the disciform scars may be surrounded by a rim of increased FAF(35,37). These areas of increased autofluorescence correspond to irregularly pigmented areas and may have been caused by a multi-layered RPE, a well-illustrated finding in histopathology (Figures 29 and 30)(36).
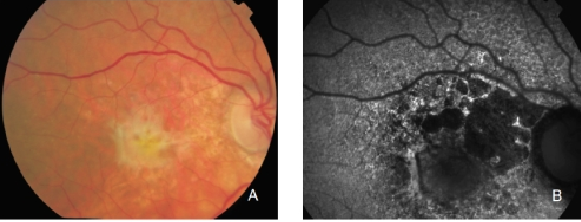
Figure 29. CNV with fibrosis. FAF outlines the marked atrophic lesions in the RPE surrounding the CNV/fibrosis. These changes are inconspicuous in colour photographs. (A) Colour fundus and (B) FAF photographs.
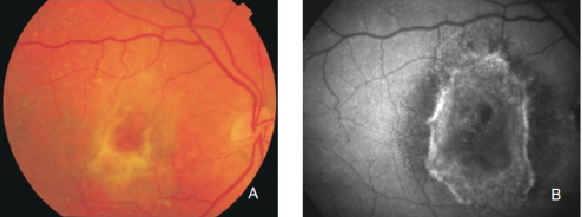
Figure 30. Fibrous scar secondary to CNV after treatment with anti-VEGF. The damaged RPE appears hyperpigmented in fundus photograph, whereas FAF imaging shows an increased signal. (A) Colour fundus and (B) FAF photographs.
Areas of GA and type II CNV may appear simultaneously (Figure 31).
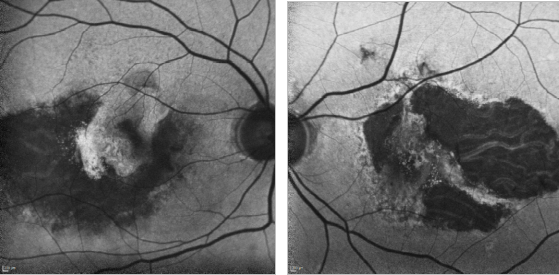
Figure 31. GA and type II CNV. FAF images of a 67-year-old woman who presents a bilateral type II AMD CNV, along with an evident RPE atrophy.
FAF study also reveals the RPE changes after anti-VEGF injections to treat a type I CNV (Figure 32).
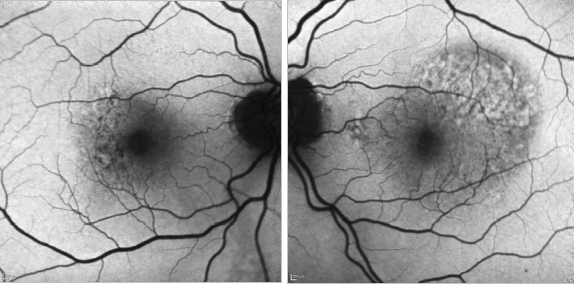
Figure 32. CNV - RPE changes. FAF of a 82-year-old man after a series of 8 anti-VEGF injections to treat a type I AMD CNV of his left eye. The right eye shows mottled RPE alterations.
In cases of a type I CNV, the detached retina is seen as a hyperfluorescent area while blood spots produce the typical mask effect (Figure 33).
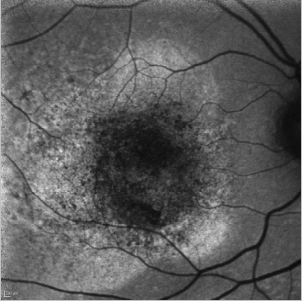
Figure 33. CNV - detached retina. FAF image of a 75-year-old woman at the moment of the diagnosis of a type I CNV. The detached retina is seen as a hyperfluorescent area while blood spots produce the typical mask effect.
References - Fundus autofluorescence in age-related macular degeneration
References - Fundus autofluorescence in age-related macular degeneration
- Eldred GE, Katz ML. Fluorophores of the human retinal pigment epithelium: separation and spectral characterization. Exp Eye Res. 1988;47(1):71-86.
- Lamb LE, Simon JD. A2E: a component of ocular lipofuscin. Photochem Photobiol. 2004;79(2):127-36.
- Bird A. Age-related macular disease. Br J Ophthalmol. 1996;80(1):2-3.
- Boulton M, Yhaw-Barker P. The role of the retinal pigment epithelium: topographical variation and ageing changes. Eye. 2001;15(Pt3):384-89.
- Feeney-Burns L, Berman ER, Rothman H. Lipofuscin of human retinal pigment epithelium. Am J Ophthalmol. 1980;90(6):783-91.
- Wing GL, Blanchard GC, Weiter JJ. The topography and age relationship of lipofuscin concentration in the retinal pigment epithelium. Invest Ophthalmol Vis Sci. 1978;17(7):601-7.
- Terman A, Brunk UT. Oxidative stress, accumulation of biological ‘garbage’, and aging. Antioxid Redox Signal. 2006;8(1-2):197-204.
- Brunk UT, Wihlmark U, Wrigstad A, Roberg K, Nilsson SE. Accumulation of lipofuscin within retinal pigment epithelial cells results in enhanced sensitivity to photo-oxidation. Gerontology. 1995;41(Suppl2):201-12.
- Solbach U, Keilhauer C, Knabben H, Wolf S. Imaging of retinal autofluorescence in patients with age-related macular degeneration. Retina. 1997;17(5):385-89.
- Eldred GE, Katz ML. Fluorophores of the human retinal pigment epithelium: separation and spectral characterization. Exp Eye Res. 1988;47(1):71-86.
- Liu J, Itagaki Y, Ben-Shabat S, Nakanishi K, Sparrow JR. The biosynthesis of A2E, a fluorophore of aging retina, involves the formation of the precursor, A2-PE, in the photoreceptor outer segment membrane. J Biol Chem. 2000;275(38):29354-60.
- Zhou J, Jang YP, Kim SR, Sparrow JR. Complement activation by photooxidation products of A2E, a lipofuscin constituent of the retinal pigment epithelium. Proc Natl Acad Sci USA. 2006;103(44):16182-7.
- Sparrow JR, Boulton M. RPE lipofuscin and its role in retinal pathobiology. Exp Eye Res. 2005;80(5):595-606.
- Dorey CK, Wu G, Ebenstein D, Garsd A, Weiter JJ. Cell loss in the aging retina. Relationship to lipofuscin accumulation and macular degeneration. Invest Ophthalmol Vis Sci. 1989;30(8):1691-9.
- Marmorstein AD, Marmorstein LY, Sakaguchi H, Hollyfield JG. Spectral profiling of autofluorescence associated with lipofuscin, Bruch‘s Membrane, and sub-RPE deposits in normal and AMD eyes. Invest Ophthalmol Vis Sci. 2002;43(7):2435-41.
- Schmitz-Valckenberg S, Fleckenstein M, Scholl HP, Holz FG. Fundus autofluorescence and progression of age-related macular degeneration. Surv Ophthalmol. 2009;54(1):96-117.
- Delori FC. Spectrophotometer for noninvasive measurement of intrinsic fluorescence and reflectance of the ocular fundus. Appl Opt. 1994;33(31):7439-52.
- Delori FC, Dorey CK, Staurenghi G, Arend O, Goger DG, Weiter JJ. In vivo fluorescence of the ocular fundus exhibits retinal pigment epithelium lipofuscin characteristics. Invest Ophthalmol Vis Sci. 1995;36(3):718-29.
- Webb RH, Hughes GW, Delori FC. Confocal scanning laser ophthalmoscope. Appl Opt. 1987;26(8):1492-99.
- Bellmann C, Holz FG, Schapp O, Volcker HE, Otto TP. Topographie der Fundusautofluoreszenz mit einem neuen konfokalen Scanning-Laser-Ophthalmoskop. Ophthalmologe. 1997;94(6):385-91.
- Von Ruckmann A., Fitzke FW, Bird AC. Distribution of fundus autofluorescence with a scanning laser ophthalmoscope. Br J Ophthalmol. 1995;79(5):407-12.
- American Nationale Standards Institute (ANSI). American National Standard for the Safe Use of Lasers. ANSI Z136.1-2007. American Nationale Standards Institute (ANSI). Washington, USA. 2007.
- Solbach U, Keilhauer C, Knabben H, Wolf S. Imaging of retinal autofluorescence in patients with age-related macular degeneration. Retina. 1997;17(5):385-89.
- Trieschmann M, Heimes B, Hense HW, Pauleikhoff D. Macular pigment optical density measurement in autofluorescence imaging: comparison of one- and two-wavelength methods. Graefes Arch Clin Exp Ophthalmol. 2006;244(12):1565-74.
- Bellmann C, Rubin GS, Kabanarou SA, Bird AC, Fitzke FW. Fundus autofluorescence imaging compared with different confocal scanning laser ophthalmoscopes. Br J Ophthalmol. 2003;87(11):1381-86.
- Spaide RF. Fundus autofluorescence and age-related macular degeneration. Ophthalmology. 2003;110(2):392-9.
- Delori FC, Goger DG, Dorey CK. Age-related accumulation and spatial distribution of lipofuscin in RPE of normal subjects. Invest Ophthalmol Vis Sci. 2001;42(8):1855-66.
- Delori FC, Fleckner MR, Goger DG, Weiter JJ, Dorey CK. Autofluorescence distribution associated with drusen in age-related macular degeneration. Invest Ophthalmol Vis Sci. 2000;41(2):496-504.
- Spaide RF. Autofluorescence imaging with the fundus camera. In: Holz FG, Schmitz-Valckenberg S, Spaide RF, Bird AC, eds. Atlas of autofluorescence imaging. Berlin, Germany. Springer. 2007;5:49-54.
- Wabbels B, Demmler A, Paunescu K, Wegscheider E, Preising MN, Lorenz B. Fundus autofluorescence in children and teenagers with hereditary retinal diseases. Graefes Arch Clin Exp Ophthalmol. 2006;244(1):36-45.
- Weiter JJ, Delori FC, Wing GL, Fitch KA. Retinal pigment epithelial lipofuscin and melanin and choroidal melanin in human eyes. Invest Ophthalmol Vis Sci. 1986;27(2):145-52.
- Lois N, Halfyard AS, Bunce C, Bird AC, Fitzke FW. Reproducibility of fundus autofluorescence measurements obtained using a confocal scanning laser ophthalmoscope. Br J Ophthalmol. 1999;83(3):276-9.
- Lois N, Halfyard AS, Bird AC, Fitzke FW. Quantitative evaluation of fundus autofluorescence imaged “in vivo” in eyes with retinal disease. Br J Ophthalmol. 2000;84 (7):741-5.
- Lois N, Owens SL, Coco R, Hopkins J, Fitzke FW, Bird AC. Fundus autofluorescence in patients with age-related macular degeneration and high risk of visual loss. Am J Ophthalmol. 2002;133(3):341-9.
- Spital G, Radermacher M, Muller C, Brumm G, Lommatzsch A, Pauleikhoff D. Autofluoreszenz-Charakteristika von Lipofuszinbestandteilen bei unterschiedlichen Formen der späten altersabhängigen Makuladegeneration. Klin Monatsbl Augenheilkd. 1998;213(1):23-31.
- Von Ruckmann A., Fitzke FW, Bird AC. Fundus autofluorescence in age-related macular disease imaged with a laser scanning ophthalmoscope. Invest Ophthalmol Vis Sci. 1997;38(2):478-86.
- Von Ruckmann A., Schmidt KG, Fitzke FW, Bird AC, Jacobi KW. Dynamik der Einlagerung und des Abtransportes von Lipofuszin im retinalen Pigmentepithel bei altersbedingter Makuladegeneration. Klin Monatsbl Augenheilkd. 1998;213(1):32-7.
- Von Ruckmann A., Fitzke FW, Bird AC. Distribution of pigment epithelium autofluorescence in retinal disease state recorded in vivo and its change over time. Graefes Arch Clin Exp Ophthalmol. 1999;237(1):1-9.
- Schmitz-Valckenberg S, Jorzik J, Unnebrink K, Holz FG. Analysis of digital scanning laser ophthalmoscopy fundus autofluorescence images of geographic atrophy in advanced age-related macular degeneration. Graefes Arch Clin Exp Ophthalmol. 2002;240(2):73-8.
- Bindewald A, Bird AC, Dandekar SS, Dolar-Szczasny J, Dreyhaupt J, Fitzke FW, Einbock W, Holz FG, Jorzik JJ, Keilhauer C, Lois N, Mlynski J, Pauleikhoff D, Staurenghi G, Wolf S. Classification of fundus autofluorescence patterns in early age-related macular disease. Invest Ophthalmol Vis Sci. 2005;46(9):3309-14.
- Sawa M, Ober MD, Spaide RF. Autofluorescence and retinal pigment epithelial atrophy after subretinal hemorrhage. Retina. 2006;26(1):119-20.
- Smith RT, Chan JK, Busuoic M, Sivagnanavel V, Bird AC, Chong NV. Autofluorescence characteristics of early, atrophic, and high-risk fellow eyes in age-related macular degeneration. Invest Ophthalmol Vis Sci. 2006;47(12):5495-504.
- Sarks JP, Sarks SH, Killingsworth MC. Evolution of geographic atrophy of the retinal pigment epithelium. Eye. 1988;2(Pt5):552-77.
- Sarks SH. Ageing and degeneration in the macular region: a clinico-pathological study. Br J Ophthalmol. 1976;60(5):324-41.
- Deckert A, Schmitz-Valckenberg S, Jorzik J, Bindewald A, Holz FG, Mansmann U. Automated analysis of digital fundus autofluorescence images of geographic atrophy in advanced age-related macular degeneration using confocal scanning laser ophthalmoscopy (cSLO). BMC Ophthalmol. 2005;5(1):8.
- Dreyhaupt J, Mansmann U, Pritsch M, Dolar-Szczasny J, Bindewald A, Holz FG. Modelling the natural history of geographic atrophy in patients with age-related macular degeneration. Ophthalmic Epidemiol. 2005;12(6):353-62.
- Sunness JS, Gonzalez-Baron J, Applegate CA, Bressler NM, Tian Y, Hawkins B, Barron Y, Bergman A. Enlargement of atrophy and visual acuity loss in the geographic atrophy form of age-related macular degeneration. Ophthalmology. 1999;106(9):1768-79.
- Schmitz-Valckenberg S, Bindewald-Wittich A, Dolar-Szczasny J, Dreyhaupt J, Wolf S, Scholl HP, Holz FG. Correlation between the area of increased autofluorescence surrounding geographic atrophy and disease progression in patients with AMD. Invest Ophthalmol Vis Sci. 2006;47(6):2648-54.
- Bindewald A, Schmitz-Valckenberg S, Jorzik JJ, Dolar-Szczasny J, Sieber H, Keilhauer C, Weinberger AW, Dithmar S, Pauleikhoff D, Mansmann U, Wolf S, Holz FG. Classification of abnormal fundus autofluorescence patterns in the junctional zone of geographic atrophy in patients with age related macular degeneration. Br J Ophthalmol. 2005;89(7):874-8.
- Holz FG, Bindewald-Wittich A, Fleckenstein M, Dreyhaupt J, Scholl HP, Schmitz-Valckenberg S. Progression of geographic atrophy and impact of fundus autofluorescence patterns in age-related macular degeneration. Am J Ophthalmol. 2007;143(3):463-72.
- Jeong YJ, Hong IH, Chung JK, Kim KL, Kim HK, Park SP. Predictors for the progression of geographic atrophy in patients with age-related macular degeneration: fundus autofluorescence study with modified fundus camera. Eye. 2014;28:209-18.
- Mauschitz MM, Fonseca S, Chang P et al. Topography of geographic atrophy in age-related macular degeneration. Invest Ophthalmol Vis Sci. 2012;53:4932-9.
- Batıoğlu F, Gedik Oğuz Y, Demirel S, Ozmert E. Geographic atrophy progression in eyes with age-related macular degeneration: role of fundus autofluorescence patterns, fellow eye and baseline atrophy area. Ophthalmic Res. 2014;52:53-9.
- Biarnés M, Arias L, Alonso J, Garcia M, Hijano M, Rodríguez A, Serrano A, Badal J, Muhtaseb H, Verdaguer P, Monés J. Increased Fundus Autofluorescence and Progression of Geographic Atrophy Secondary to Age-Related Macular Degeneration: The GAIN Study. Am J Ophthalmol. 2015;160:345-53 e5.
- Dreyhaupt J, Mansmann U, Pritsch M, Dolar-Szczasny J, Bindewald A, Holz FG. Modelling the natural history of geographic atrophy in patients with age-related macular degeneration. Ophthalmic Epidemiol. 2005;12:353-62.
- Domalpally A, Danis RP, White J, Narkar A, Clemons T, Ferris F, Chew E. Circularity index as a risk factor for progression of geographic atrophy. Ophthalmology. 2013;120:2666-71.
- Caire J, Recalde S, Velazquez-Villoria A, Garcia-Garcia L, Reiter N, Anter J, Fernandez-Robredo P, Alfredo García-Layana; Spanish Multicenter Group on AMD. Growth of geographic atrophy on fundus autofluorescence and polymorphisms of CFH, CFB, C3, FHR1-3, and ARMS2 in age-related macular degeneration. JAMA Ophthalmol. 2014;132:528-34.
- Holz FG, Pauleikhoff D, Spaide RF, Bird AC. Age-related macular degeneration. Berlin, Germany. Springer. 2004; 1-234 p.
- Dandekar SS, Jenkins SA, Peto T, Scholl HP, Sehmi KS, Fitzke FW, Bird AC, Webster AR. Autofluorescence imaging of choroidal neovascularization due to age-related macular degeneration. Arch Ophthalmol. 2005;123(11):1507-13.
- Vaclavik V, Vujosevic S, Dandekar SS, Bunce C, Peto T, Bird AC. Autofluorescence imaging in age-related macular degeneration complicated by choroidal neovascularization: a prospective study. Ophthalmology. 2008;115(2):342-6.
- McBain VA, Townend J, Lois N. Fundus autofluorescence in exudative age-related macular degeneration. Br J Ophthalmol. 2007;91(4):491-6.
- Schmitz-Valckenberg S, Holz FG, Bird AC, Spaide RF. Fundus autofluorescence imaging: review and perspectives. Retina. 2008;28(3):385-409.
- Karadimas P, Paleokastritis GP, Bouzas EA. Fundus autofluorescence imaging findings in retinal pigment epithelial tear. Eur J Ophthalmol. 2006;16(5):767-69.